SQL Server Profiler (edit)
How to capture queries, tables and fields using the SQL Server Profiler
Get statistics of Stored Procedures execution using SQL Trace
Capturing Parameters of a Stored Procedure Call
https://sqlity.net/en/976/capturing-parameters-of-a-stored-procedure-call/
SQL Server: Using SQL Server Profiler to Capture Stored Procedure Call from Application
http://www.connectsql.com/2011/10/sql-server-using-sql-profiler-to.html
How To Profile Stored Procedures
https://dba.stackexchange.com/questions/29284/how-to-profile-stored-procedures
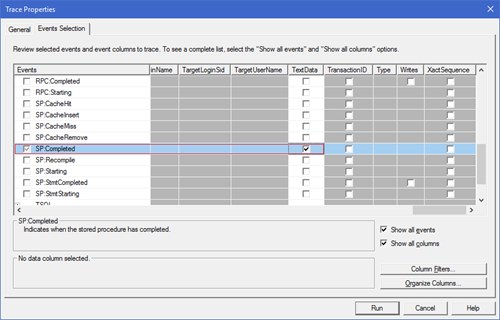
Kevin's answer describes what events to capture in SQL Trace/SQL Server Profiler. To expand on that answer a bit - SP:Completed will show you each statement within a stored procedure being completed, as it sounds.
Also if you are on a busy system and trying to diagnose a performance issue you should be careful with SQL Server Profiler. SQL Server Profiler is much slower than tracing to a file or using Extended Events. This blog post by Jonathan Kehayias shows about a 90% overhead on a system's performance from using SQL Server Profiler and about a 10% overhead from tracing to file. Less for Extended Events. That is why it is typically recommended to not run SQL Server Profiler itself whil
While this information is available through Extended Events, I would suggest still using SQL Trace (the technology behind SQL Server Profiler) but tracing to a file instead (if you wanted to invest in learning and using Extended Events this would be the way to go, in a future version of SQL Server SQL Trace will be gone and all we'll have is Extended Events) . I would also suggest you filter through the Column Filters button out as much background noise as possible to make sure you are only capturing what is necessary. You can setup your trace with the Profiler tool using the steps Kevin describes in his good answer and then add a filter from that same GUI. Then you can export the trace as a script and run that script on SQL Server tracing to a file on a folder that doesn't contain database or transaction log files. To export, you would simply setup your trace, run it for a few seconds to just make sure you are capturing what you want, stop it and then go to the menu bar and File -> Export -> Script Trace Definition and save the file. Then open that file in a new query window on the server you intend to trace. You can see more about the options and definitions of this script you created by looking at the help articles for the various stored procedures used in that script you just created by starting here.
If you have time and want to learn, you can also read some articles on Extended Events and see how to capture the information as well. Jonathan Kehayias is a great resource for blog posts when you are ready to start there.
Save result to the Table
CREATE TABLE [dbo].[Test] ([RowNumber] int IDENTITY(0,1) PRIMARY KEY, [EventClass] int NULL,[TextData] ntext NULL,[SPID] int NULL,[BinaryData] image NULL)
QUERY
select * from Test where TextData like '%exec Get%'
and TextData not like '%exec GetAllLanguage%'
and TextData not like '%exec GetLanguage%'


